To conduct an analysis of which players out-performed their price tags and which ones crumbled under its pressure, it’s necessary to define how we are judging a player’s performance and how the price tag is related to the performance of the player.
To quantify the performance of a player over the whole season we can use the cricWAR framework [Rafique, 2023] which measures the number of wins added by a player over the course of the season compared to a “freely available player”.
I wrote about how performance correlates with the price tag of a player here: Moneyball in the IPL, a quick summary: Price tags are not linearly related to player performance since the number of spots in a team is limited. Thus, any player who can provide more WAR compared to another is exponentially more valuable since you will have to use 2 or more of your available slots to match that performance. We fit an exponential curve to the percentage of purse the player is paid to the value (WAR) they generate to get a curve that shows the expected value at any given price. This lets us calculate the players who provide more or less value than is expected at their price tag and is called Value Over Price Expectation (VOPE) here.
Furthermore, price tags are not only dependent on player performance but also the role they fulfill in the team (e.g. fast bowling all-rounders are more scarce than top-order batters) and Indian players command a premium since overseas players are restricted to 4 of the 12 slots. Thus, we can fit a model that accounts for the players, price, role and overseas status to determine the expected value and then calculate the surplus or deficit of value they create from this expectation. This is called Value Over Market-Adjusted Model (VOMAM) below.
Value of the player also depends on factors like age, retention cycles, marketability etc. but these factors are hard to quantify for a single season and are thus not considered for this analysis but can be incorporated later to develop a more holistic value model.
For the 2026 season we fit the VOPE curve and got the following results:
You can see that the curve expects much higher returns on players who are paid around 5 Cr than the ones below 1 Cr, since this is the price point usually where key role players on teams are picked rather than backups and young investments. And after 10 Cr the curve gets flatter and there is a rapidly diminishing marginal value that players above this price range provide compared to the ones bought around this price.
Now looking at the results, we used the players’ performance to calculate the return on investment. The initial approach is to calculate a general rate of price per added win = 10.59 Cr, then we can compare the player’s performance to identify the return they provided as:
ROI = actual WAR × price per added win rate − actual price
Where actual WAR × price per added win rate represents the market price for their performance.
We also use the same bootstrap methodology as the cricWAR paper to sample the balls played by the players to generate 95% confidence intervals of their WAR and thus their ROI. This helps to account for the high variability in player performances. We also calculate the probability of a player being a bargain buy (value generated > price paid, i.e. ROI > 0) for all the bootstrap iterations and this value is represented as p(bargain).
Here is a full ranking of players listed by WAR, VOPE, VOMAM, ROI, RORAM. Sort by any of the value or ROI metrics to see the biggest steals and busts, filter by teams to see a franchise’s results.
We observed that keepers are systematically overpriced due to the scarce nature of their value and skillset, so similar to VOMAM, we can adjust the ROI based on the role and the overseas status. On calculation, both domestic and overseas players have the same price/win added rate = 10.59 Cr, so we focused only on adjusting based on the role and found that keepers are the most expensive roles to get value from compared to pacers who are cheaper. This metric is included in the leaderboard above as well as Return On Role-Adjusted Model (RORAM).
Discussion of results
Suryavanshi is obviously #1, he had not just the best player performance in this IPL but maybe in all IPL seasons so far and he comes at a measly 1.1 Cr price tag. No one else even comes close.
On both the models, Vaibhav Suryavanshi is off the charts. But the VOMAM model helps us value the scarce positions like wicket-keepers more accurately compared to an abundant position like top-order batter or fast bowler where there are a lot more players providing above-replacement player level performance.
there are 3 types of players who are bargain buys:
- Uncapped Indian talent who burst onto the scene this year (Prince Yadav, Sakib Hussain, Priyansh Arya)
- Overseas veterans who were picked up for base price (e.g. Finn Allen, Lungi Ngidi)
- IPL cornerstones who delivered phenomenal seasons and went even beyond their expensive price tags (e.g. Bhuvi, Narine)
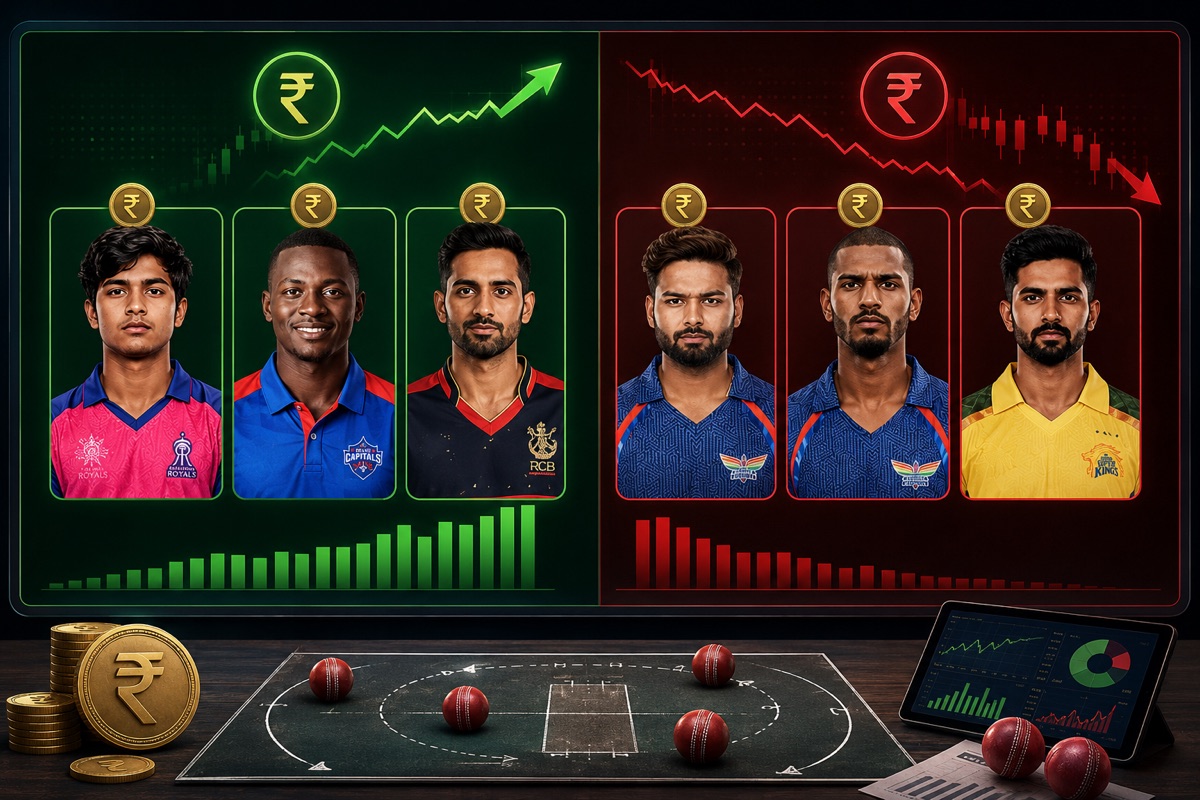
The bottom of the list contains all the players who were bought to be cornerstones of their respective franchises but had terrible seasons, e.g. Pant, Pooran, Gaikwad and Pathirana. The keepers are already the most expensive player category to extract value from, and poor seasons like that of Pant and Pooran hurt teams the most due to their expensive price tags and negligible addition of value, even after adjusting for position scarcity.
Here are the biggest steals of the auction this year and the biggest busts, the points represent the ROI in Cr terms as we discussed above. The 95% bands around them are generated from the bootstrap iterations to visualize the variance in the results.
The auction rewards the same thing every year: finding wins before the market prices them. The biggest returns this season came from places nobody paid a premium for, uncapped Indians breaking out and overseas veterans picked up at base price, while the safest and most expensive buys were 50/50 on ROI, and the keepers hurt the most when they missed. IPL teams need to incorporate the player’s price tag and evaluate it against their performance to make sure they are not handicapping their seasons before they begin with expensive retentions and overpaid buys.